Introduction
Edward Colston was an investor, official and eventually deputy governor of the Royal African Company (RAC) from 1680-92.[1] Over this period the RAC purchased and transported tens of thousands of enslaved Africans across the Atlantic into a life of hard labour. This article aims to answer number of questions about the RAC’s involvement in the slave trade in particular during Edward Colston’s tenure. These questions are:
- How many enslaved Africans were purchased by the RAC between 1680 and 1692?
- How many survived the journey across the Atlantic?
- What was the mortality rate?
- Where did the captives come from?
- Where were these Africans being transported to?
- What was the breakdown by age and gender of the captives?
- What was the approximate value of these captives to the RAC?
Two sets of figures are employed here to estimate the number of Africans transported across the Atlantic from 1680-1692 by the RAC.
Estimates based on data at destination
The first set of figures comes from Carlos and Kruse[2] whose 1996 paper uses statistics originally published by Davies in his seminal work The Royal African Company published in 1957.[3] Carlos and Kruse give a table[4] of slave population and the numbers of enslaved Africans imported by the RAC into Barbados, Jamaica and the Leeward Islands[5] for the period 1673-1712. This data is reproduced in Table 1 with the 1680-92 period highlighted.
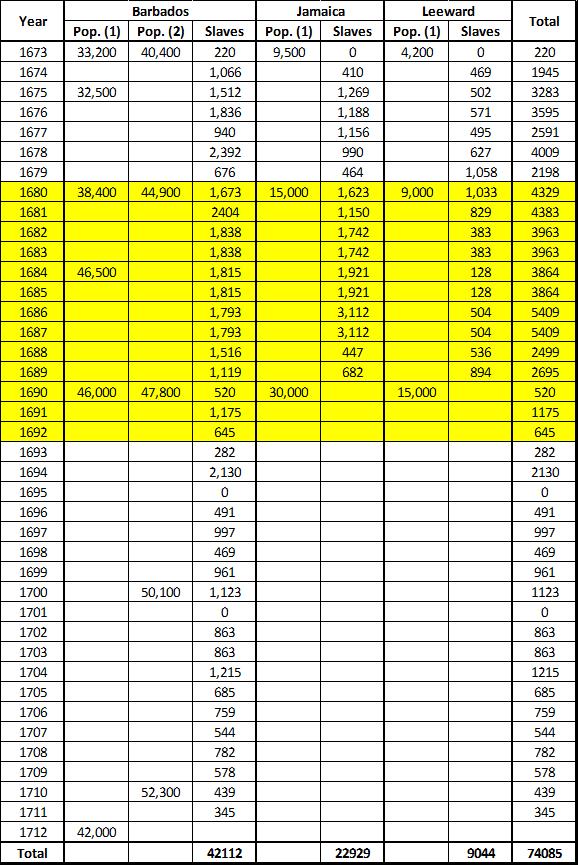
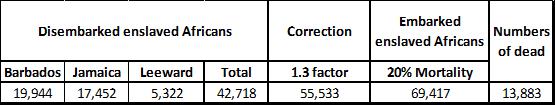
Based on this data Table 2 states the total number of enslaved Africans disembarked in Barbados, Jamaica and the Leeward Islands for the period 1680-92 as 42,718. Carlos and Kruse note that in another study Eltis had argued that:
that the Davies figures underestimate the number of slaves delivered by the Royal African Company, by perhaps 30%[6]
According to Eltis this was because:
Not all auction sales seem to have been included in the invoice books on which Davies relied. Near the end of the Company’s busiest decade the RAC calculated its own sales from auctions at 46,396 slaves, 6,000 (15 percent) greater than Davies’s figure. Moreover, Davies made no systematic use of Naval Office or more generally Colonial Office documents in his study. He thus bypassed sources that would have provided information on the ‘contract’ arrivals of slaves that were not put up for auction These arrivals were more numerous than he assumed. It is not always possible to identify RAC ships once one moves away from the T70 series but count of only those slaves carried in clearly identifiable RAC ships yields minimum estimate from the data set of 125,000 slaves from 1672 to 1711, the years of Davies series. The actual figure is probably higher by several thousand. The Davies count of RAC arrivals alone thus needs to be increased by at least 30 percent[7]
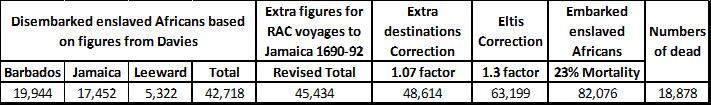
This adjustment to Davies’s figures has been made in Table 2, giving a revised figure of 55,533 enslaved Africans delivered from 1680-92. Eltis also calculated the average mortality rate for the transatlantic crossing at 20% for the period 1662-1713.[8] Employing this factor gives in Table 2 an estimate of enslaved Africans embarked (69,417) and the numbers who died on route (13,883).
These estimates are conservative for several reasons. First, they only cover deliveries of enslaved Africans by the RAC to particular Caribbean islands. It would be expected that some RAC trade would have occurred with other parts of the Caribbean, mainland American colonies and perhaps eastwards through collaboration with the East India Company.[9] These deliveries have not have been recorded in this data. Second, there was some corruption internal to the RAC whereby ship’s captains chartered by the RAC smuggled and clandestinely sold slaves for their own profit. Although, Carlos and Kruse note this practice they recognise that calculating figures for it is problematic.[10] Finally, the 30% correction to Davies’s figures applied by Eltis is conservative.[11]
Estimates based on slave ship voyage data
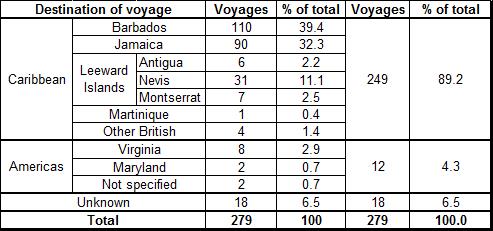
The second set of figures for RAC shipments of enslaved Africans across the Atlantic are derived from the Trans-Atlantic Slave Trade Database, an online resource which logs individual slave ship voyages across the Atlantic from 1514-1866.[12]A search of this database for RAC owned ships over the period 1680-92 yielded 279 voyages with the majority of disembarkations (87.5%) in the Caribbean destinations quoted by Davies (Barbados, Jamaica and the Leeward Islands) as shown in Table 3.
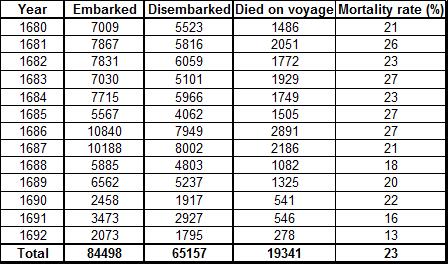
A summary of the number of slaves embarked and disembarked by year for the period 1680-92 is given in Table 4. The overall embarkation and disembarkation figures of 84,498 and 65,157 respectively allow the deaths of enslaved Africans on the trans-Atlantic crossing to be calculated as 19,341. This gives an average mortality rate per voyage of approximately 23%, suggesting that between 1-in-4 and 1-in-5 of enslaved Africans died on route.
Comparison of data sources
Initial comparison of the figures based on slave ship voyages with the previous estimates shows that they are considerably larger. However, two factors derived from the later analysis need to be applied to the original data in order to make an accurate comparison:
- As noted previously in this article Davies’s figures (reproduced by Carlos and Kruse) only cover RAC deliveries to Barbados, Jamaica and the Leeward Islands. Table 3 shows that only 87% of the voyages in the Trans-Atlantic Slave Trade Database went to these three destinations. A factor (1.07) taking into account the extra and unknown destinations can thus be applied to Davies’s original figures to take account of the difference in source data.[13]
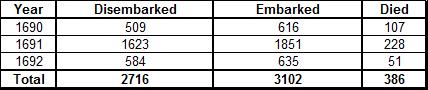
- Davies’s figures (quoted by Carlos and Kruse) shown in Table 1 for Jamaica and the Leeward Islands do not cover the period 1690-92. However, an examination of the Trans-Atlantic Slave Trade Database shows that there were seven voyages to Jamaica in this period, though none to the Leeward Islands. The data for the Jamaican voyages is given in Table 5. The extra 2716 enslaved Africans transported to Jamaica should be added to Davies’s baseline data in Table 2.
- Eltis’s assumed mortality rate of 20% in Table 2 has been shown to be an underestimate for RAC slave ship voyages in the period 1680-92. The latter figure of 23% should be applied to the calculation.
These revised factors are applied to the data in Table 2 and the results are shown in Table 6.
With the two new correction factors a comparison can be made between the two sets of data, as shown in Table 7.
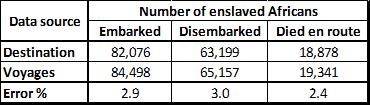
As the less accurate figures based upon data at the destination of the voyages are approaching that for the slave ship voyages and lie within 3%, the Trans-Atlantic Slave Trade Database is considered to be the most accurate information and will used as the primary data source for further investigation.
Additional data on enslaved Africans transported by the RAC from 1680-92
The Trans-Atlantic Slave Trade Database provides several categories of data concerning the enslaved Africans transported by the RAC which can be extracted for the period 1680-92. Table 8 gives the location of the purchase of the enslaved Africans and these are mapped in Figure 1 along with the principal destinations of the RAC voyages.
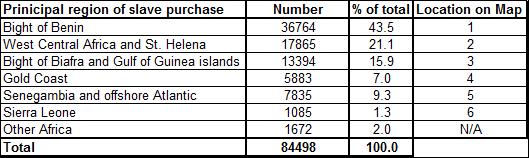
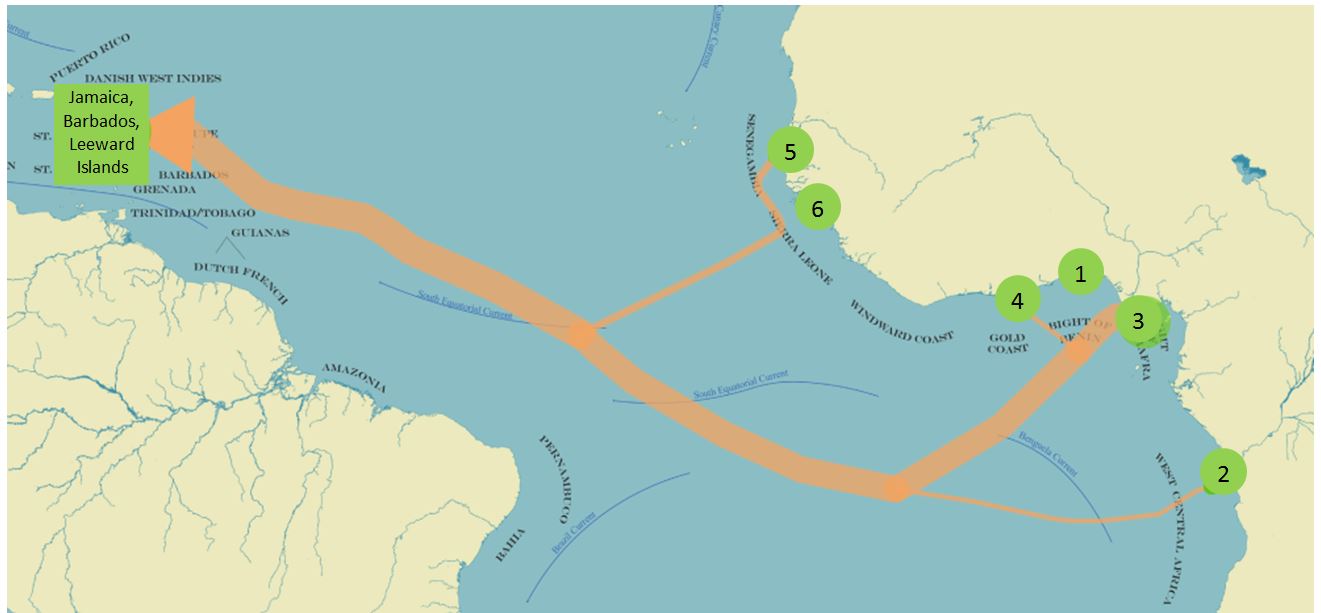
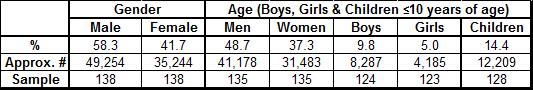
Table 9 gives a breakdown by age and gender of the captives based on significant samples of the 279 voyages undertaken by the RAC between 1680 and 1692. The percentage fractions are derived from a weighted average of the data from each voyage in the sample. This allows a rough estimate of the numbers of enslaved Africans embarked on RAC ships in each category. Boys and girls are loosely defined as being of ten years of age or younger.[14]
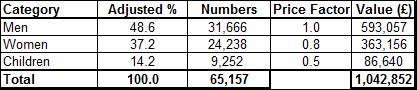
From the Trans-Atlantic Slave Trade Database it is possible to calculate the approximate monetary value of the surviving captives at sale in the Caribbean. This is achieved by averaging the price, based upon temporally dependent archival data for Jamaica over the period 1680-92. This yielded an average price for a ‘prime male’ of £18.73.[15] Using price factors derived from historic data for women (0.8) and children (0.5),[16] an adjusted[17] percentage breakdown by age and gender of cargoes given in Table 9 and the number of disembarked slaves from Table 7 (65,157) it was possible to estimate the total trading value (in pounds sterling) of enslaved Africans moved by the RAC over the twelve year period (1680-92). The results are given in Table 10.
Employing the Measuring Worth website[18] and assuming the mid-point in the period of interest (1680-92) as 1896 the relative value in 2015 of wealth calculated in Table 10 can be calculated in various ways; using:
- historic standard of living value[19]gives £159,900,000 (~£160 million pounds)
- labour earnings[20] gives £1,949,000,000 (~£2 billion pounds)
- economic status[21] value gives £4,952,000,000 (~5 billion pounds)
- economic power[22] value gives £35,270,000,000 (~35 billion pounds)
It should be noted that this is only the value at sale of the enslaved Africans, it does not represent profit as such, as purchase cost, and other fixed and variable costs have to be subtracted. However, neither does it represent the whole monetary value available to the RAC, as the final leg of the trading triangle would liberate further profit through the sale in Britain of slave produced commodities purchased in mainland America and the Caribbean. It does, however, provide a guide to the magnitude of the trade in enslaved Africans in monetary terms.
Summary
The correlation of two different sources of data, one based on the point of sale and the other at the point of embarkation of enslaved Africans has made it possible to estimate with confidence the numbers transported across the Atlantic by the RAC in period of Edward Colston’s management and leadership of the business (1680-92). The conservative figure of approximately 84,500 Africans embarked and 65,200 disembarked produces a death toll in the region of 19,300 over the twelve year period. This equates to a mortality rate of 23% on RAC voyages.
An analysis of the transported showed that the majority were male (58%) and a significant minority were children of ten years of age or younger (14%). Most of the enslaved Africans (~80%) were embarked from three areas (in order of importance), the Bight of Benin, West Central Africa and St Helena and the Bight of Biafra and the Gulf of Guinea Islands. The majority (~89%) were transported to three main locations in the Caribbean (in order of importance) Barbados, Jamaica and the Leeward Islands (Nevis, Montserrat and Antigua).
A monetary estimate of the value of the 65,200 Africans sold in the Caribbean and mainland America yields more than 1 million pounds sterling which equates to somewhere between 2 and 35 billion pounds today.
Bibliography
Carlos, A. M. and Kruse J. B. “The decline of the Royal African Company: Fringe firms and the role of the charter”. The Economic History Review 49, no. 2 (1996): 291-313.
Davies, K. G. The emergence of international business 1200-1800 Vol. 5: The Royal African Company. London: Routledge, 1957.
Eltis D. “The Volume and African Origins of the British Slave Trade before 1714”. Cahiers d’études Africaines, vol. 35, n°138-139, 1995.
Parkinson, A. and Chew, L. “Mercantilism, globalisation, unethical practices, corruption: A case study of the relationship between the English East India Company and the monarchy in the context of collaborations in the slave trade and other commercial activities in the Seventeenth Century”. Global Conference on Business and Finance Proceedings Vol. 8 No. 1 (2013) pp. 26-8.
Wilkins, H. J. Edward Colston (1636-1721 A.D.), a Chronological Account of His Life and Work Together with an Account of the Colston Societies and Memorials in Bristol. Bristol: Arrowsmith, 1920.
Websites
Measuring Worth https://measuringworth.com/
Trans-Atlantic Slave Trade Database http://www.slavevoyages.org/
- [1] Wilkins, H. J. Edward Colston (1636-1721 A.D.), a Chronological Account of His Life and Work Together with an Account of the Colston Societies and Memorials in Bristol. Bristol: Arrowsmith, 1920 [Back...]
- [2] Carlos, A. M. and Kruse J. B. “The decline of the Royal African Company: Fringe firms and the role of the charter”. The Economic History Review 49, no. 2 (1996): 291-313 [Back...]
- [3] Davies, K. G. The emergence of international business 1200-1800 Vol. 5: The Royal African Company. London: Routledge, 1957 [Back...]
- [4] Carlos, A. M. and Kruse J. B. “The decline of the Royal African Company” Table 3 p. 309 [Back...]
- [5] The Leeward Island chain consists of Puerto Rican Virgin Islands, U.S. Virgin Islands, British Virgin Islands, Anguilla, Saint Martin, Saint-Barthélemy, Saba, Sint Eustatius, Saint Kitts, Nevis, Barbuda, Antigua, Redonda, Montserrat, Guadeloupe, la Désirade, Îles des Saintes, Marie-Galante and Dominica [Back...]
- [6] Carlos, A. M. and Kruse J. B. “The decline of the Royal African Company” p. 308 n. 65 [Back...]
- [7] Eltis D. “The Volume and African Origins of the British Slave Trade before 1714”. Cahiers d’études Africaines, vol. 35, n°138-139, 1995. pp. 621-2 [Back...]
- [8] Ibid. Table III p. 620 [Back...]
- [9] Parkinson and Chew’s investigation into the relationship between the RAC and the East India Company (EIC) suggests that the latter was given contracts by the RAC to carry human cargo across the Atlantic. The EIC was also involved in shipping enslaved Africans to India and the East Indies. Parkinson, A. and Chew, L. “Mercantilism, globalisation, unethical practices, corruption: A case study of the relationship between the English East India Company and the monarchy in the context of collaborations in the slave trade and other commercial activities in the Seventeenth Century”. Global Conference on Business and Finance Proceedings Vol. 8 No. 1 (2013) pp. 26-8 [Back...]
- [10] Carlos, A. M. and Kruse J. B. “The decline of the Royal African Company” pp. 298-303 [Back...]
- [11] Eltis D. “The Volume and African Origins of the British Slave Trade before 1714” p. 622 [Back...]
- [12] This data base can be found at http://www.slavevoyages.org/ [Back...]
- [13] This factor was calculated by assuming the 6.5% of unknown destinations were in the same ratio as those to the Caribbean group in Davies figures (Barbados, Jamaica and Leeward Islands, which make up 87.5% of the data) and mainland America and other Caribbean islands (which make up 6.1% of the data). By weighting the unknowns by this ratio it was calculated that 6.1% were deliveries to the former group. In total therefore it can be conservatively assumed that 87.5% + 6.1% = 93.6% of the RAC voyages went to the destinations delineated by Davies. This produces an approximate factor of 100/93.6 = 1.07 which should be applied to the original Davies data to take account of the extra destinations that RAC slave ships travelled to. [Back...]
- [14] For a fuller description of the limitations to this approach see: http://www.slavevoyages.org/voyage/understanding-db/methodology-6 [Back...]
- [15] For more details on how prices were derived see http://www.slavevoyages.org/voyage/understanding-db/methodology-20 [Back...]
- [16] http://www.slavevoyages.org/voyage/understanding-db/methodology-6 [Back...]
- [17] This small downwards adjustment is due to the variable sample size in Table 9 [Back...]
- [18] See https://measuringworth.com/ [Back...]
- [19] This measures the purchasing power of an income or wealth in its relative ability to purchase a (fixed over time) bundle of goods and services such as food, shelter, clothing, etc., that an average household would buy. This bundle does not change over time. This measure uses the Retail Price Index [Back...]
- [20] This measures the amount of income or wealth relative to the earnings of an average worker [Back...]
- [21] This measures the relative “prestige value” of an amount of income or wealth between two periods using the income index of the per-capita Gross Domestic Product [Back...]
- [22] This measures the amount of income or wealth relative to the total output of the economy. When compared to other incomes or wealth, it shows the relative “influence” of the owner of this income or wealth has in controlling the composition or total-amount of production in the economy. This measure uses the share of Gross Domestic Product [Back...]